With the use of InfluxDB in combination with Grafana, one can visualize all the measured data in a comfy way.
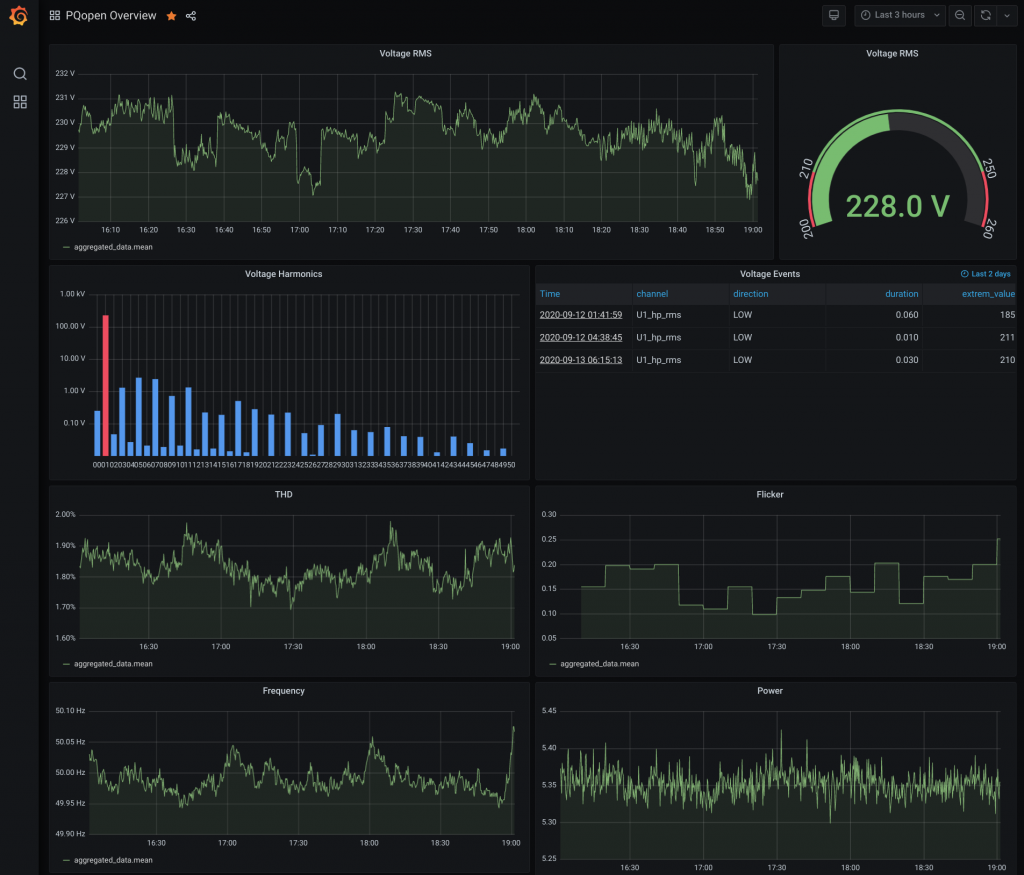
Ask for Login Credentials, if you are interested.
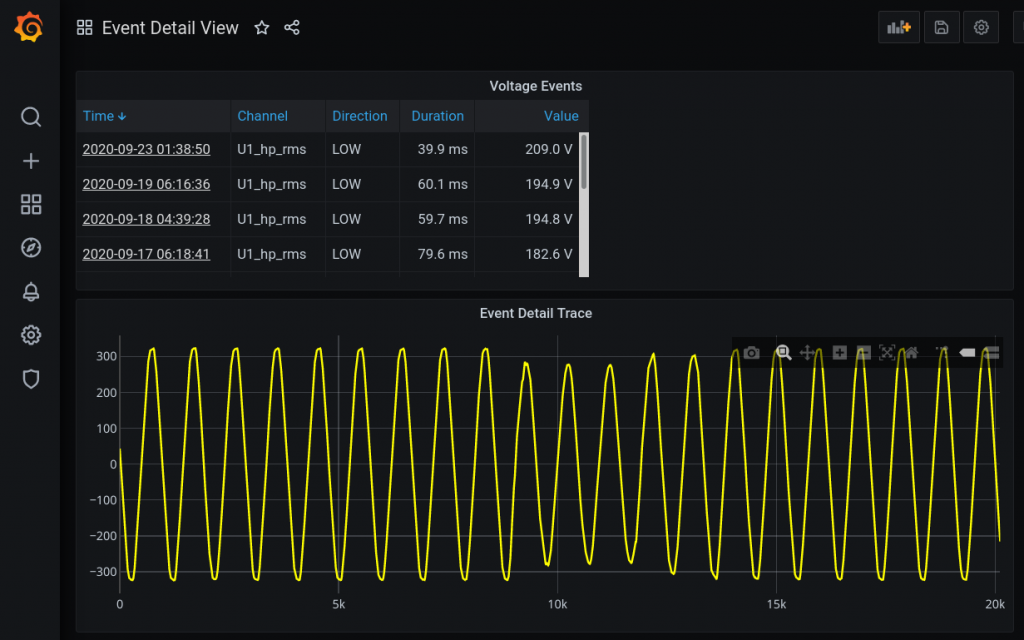
With the use of InfluxDB in combination with Grafana, one can visualize all the measured data in a comfy way.
Ask for Login Credentials, if you are interested.